Posts

Showing posts from 2017

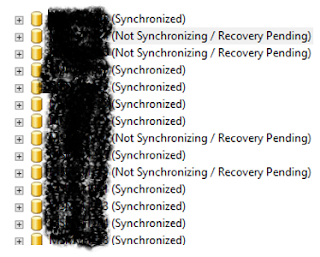
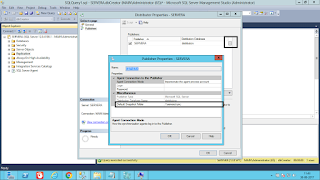
LOG_REUSE_WAIT_DESC showing as 'REPLICATION' and also SNAPSHOT Publication Configured.

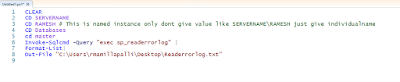
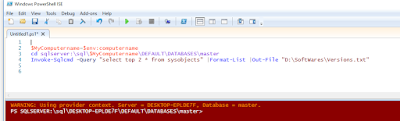
I would like to rephrase the sentence like this as "Size of the Transaction log of a database which is in Snapshot publication has been increasing and not able to shrink or truncate because log_reuse_wait_desc showing as REPLICATION" To work on this issue i google like anything every where i found log_reuse_wait_desc showing 'REPLICATION' but replication is not configured. After i put a certain amount of time on google i found a MSDN article ,only one article which described about this. And i want to document that in my own words in my blog. One day in my service now dash board i got a ticket saying as Transaction log file of a particular database has been increased. As a part of troubleshooting i check teh below things. Assume here my database name is TEST Findings: 1)  Test Database is in simple recovery model 2)  If i run the below command i found log_reuse_wait_desc showing as 'REPLICATION' 3) select log_reuse_wait,log_reuse_wait_ desc,* fr

SQL Server Database Architecture

Image

Log Shipping Architecture in SQL Server

Image
The below image will describe about Log shipping in SQL Server.

How to connect to SQL Server Named instance from Powershell

Image
You need to pass the values like below. When you are trying to connect to the SQL Server Named instance from Windows PowerShell. Dont give instance name here in this fomat like servername\instancename. Simply pass instance name alone.

Folder creation in Windows by using Windows powershell

Image
To day i have done one more task with power shell command which creates a folder in D drive. I have written the script like below. Though you can find the error in the script, however it create a folder in the respective drive.

Connecting SQL Server from Windows Powershell

Image
This is my first effort connecting sql server through windows power shell command. I am able to access the SQL Server default instance with the below command and able to export or get those results to notepad.

Databases status showing as Not Synchronizing/Recovery Pending in SQL Server Always On Secondary replica.

Image
Recently i have come across one issue in my environment where i found databases have gone into Not Synchronizing/Recovery pending state in one of the secondary replicas as shown given below. In though above image there are 4 databases have gone into NotSynchronizing/ Recovery Pending state. However i am going explain here about one database. Check the same database status Under Availability Groups-->Under Avaiability Databases. If you see the status of the database has shown like this If you see the database status shown as in Red. Now runt the below command in Secondary replica. ALTER DATABSE  DatabaseName SET HADR OFF Once you run this command you can see the database status will change to Warning mode from error mode as shown below. At the same time you observer same database status in under databases it will change to restoring mode from Not Synchronizing /Recovery pending state to Restoring mode as shown below. Now you right click on the status o

DATABASE LEVEL PERMISSIONS ON SQL SERVER

Image
The below image will explain you about Database level permissions at database level. Extracted from BOL.

Getting logins account information from the server who are having sysadmin Privilege

/****** Getting logins account information  from the server who are having sysadmin Privilege. But we can use this for other servers also if need. Script Date: 10/4/2017 Author: Ramesh. M ******/ SET NOCOUNT ON USE master go DECLARE @Table TABLE (ServerRole VARCHAR(50),[Member] VARCHAR(100),MemberSID VARCHAR(1000)) DECLARE @Table1 TABLE (Sno INT IDENTITY(1,1),Name VARCHAR(2000)) DECLARE @CaptureLoop TABLE (accountname varchar(200),types varchar(200),privelege varchar(100), MappedLogin varchar(100),PermissionPath VARCHAR(100)) INSERT INTO @Table1 (Name) SELECT NAME FROM sys.server_principals WHERE type IN('g'); DECLARE @i int declare @Count INT declare @Catchvalue VARCHAR(50) SET @i=0 SELECT @Count=COUNT(*) FROM sys.server_principals WHERE type IN('g') --PRINT @Count INSERT INTO @Table (ServerRole,[Member],MemberSID) exec sp_helpsrvrolemember 'sysadmin' WHILE @I<@Count BEGIN   set @i=@i+1   SELECT @Catchvalue=Name   FROM @

Memory Error: A timeout occurred while waiting for memory resources to execute the query in resource pool 'internal' (1). Rerun the query. 

Today in my environment i got this error and realized that this happened due to memory pressure. To confirm this whether is this really happened due to memory or not  i have ran the below queries. Symtoms for Memory pressure: If you run the below command and if it shows last waittype as RESOURCE_SEMAPHORE then it meas it is clearly memory issue 1)SELECT * FROM SYSPROCESSES WHERE lastwaittype LIKE '%RESOURCE%' 2) Another query you run the below one. Which shows long running queries in SQL Server along with memory ,CPU. And at this time there is also chance that CPU also is hike at that moment. The below query will also provide you query and its execution plan. Which intern also give you the recommend indexes SELECT session_id,DB_NAME(DATABASE_ID), text, query_plan FROM sys.dm_exec_requests CROSS APPLY sys.dm_exec_sql_text(sql_handle) CROSS APPLY sys.dm_exec_query_plan(plan_handle) ; 3) Another way to look at his in the 'perfmon' counter. Which is perfo

Finding Currently running long running queries or CPU intensive Queries.

SELECT TOP ( 10 ) SUBSTRING(ST.text, ( QS.statement_start_offset / 2 ) + 1, ( ( CASE statement_end_offset WHEN -1 THEN DATALENGTH(st.text) ELSE QS.statement_end_offset END - QS.statement_start_offset ) / 2 ) + 1) AS statement_text , execution_count , total_worker_time / 1000 AS total_worker_time_ms , ( total_worker_time / 1000 ) / execution_count AS avg_worker_time_ms , total_logical_reads , total_logical_reads / execution_count AS avg_logical_reads , total_elapsed_time / 1000 AS total_elapsed_time_ms , ( total_elapsed_time / 1000 ) / execution_count AS avg_elapsed_time_ms , qp.query_plan FROM sys.dm_exec_query_stats qs CROSS APPLY sys.dm_exec_sql_text(qs.sql_handle) st CROSS APPLY sys.dm_exec_query_plan(qs.plan_handle) qp ORDER BY total_worker_time DESC -----There is also another query for the same SELECT s.session_id, r.status, r.blocking_session_id 'Blk by', r.wait_type, wait_resource, r.wait_time / (1000 * 60) 'Wait M', r.cpu_time, r.l

Replication-Replication Distribution Subsystem: agent SERVERA-dbCreator-TranPub_dbCreator-SERVERB-6 failed. The process could not read file 'C:\Replication\unc\SERVERA_DBCREATOR_TRANPUB_DBCREATOR\20170830103552\Subjects_2.pre' due to OS error 3.

Image
Error message: I got this error when i am trying to configure Transnational publication in replication. I have chosen pull subscription while i am configuring Transnational publication Error messages: The process could not read file 'C:\Replication\unc\SERVERA_DBCREATOR_TRANPUB_DBCREATOR\20170830103552\Subjects_2.pre' due to OS error 3. (Source: MSSQL_REPL, Error number: MSSQL_REPL20024) Get help: http://help/MSSQL_REPL20024 The system cannot find the path specified.  (Source: MSSQL_REPL, Error number: MSSQL_REPL3) Get help: http://help/MSSQL_REPL3 From Eventviewr: Replication-Replication Distribution Subsystem:  agent SERVERA-dbCreator-TranPub_dbCreator-SERVERB-6 failed.  The process could not read file 'C:\Replication\unc\SERVERA_DBCREATOR_TRANPUB_DBCREATOR\20170830103552\Subjects_2.pre'  due to OS error 3. Troubleshooting Step: 1) When i check the snapshot agent status it has run fine. No issues with it 2) When i check log reade

SQL SERVER ARCHITECTURE

Image
SELECT Statement Life Cycle Summary: UPDATE  Query Life Cycle:

Finding which WAIT TYPE is high at SQL Server end.

Image
WITH Waits AS ( SELECT wait_type, wait_time_ms / 1000. AS wait_time_s, 100. * wait_time_ms / SUM(wait_time_ms) OVER() AS pct, ROW_NUMBER() OVER(ORDER BY wait_time_ms DESC) AS rn FROM sys.dm_os_wait_stats WHERE wait_type NOT IN ('CLR_SEMAPHORE', 'LAZYWRITER_SLEEP', 'RESOURCE_QUEUE', 'SLEEP_TASK', 'SLEEP_SYSTEMTASK', 'SQLTRACE_BUFFER_FLUSH', 'WAITFOR', 'CLR_AUTO_EVENT', 'CLR_MANUAL_EVENT') ) -- filter out additional irrelevant waits SELECT W1.wait_type, CAST(W1.wait_time_s AS DECIMAL(12, 2)) AS wait_time_s, CAST(W1.pct AS DECIMAL(12, 2)) AS pct, CAST(SUM(W2.pct) AS DECIMAL(12, 2)) AS running_pct FROM Waits AS W1 INNER JOIN Waits AS W2 ON W2.rn <= W1.rn GROUP BY W1.rn, W1.wait_type, W1.wait_time_s, W1.pct HAVING SUM(W2.pct) - W1.pct < 95; -- percentage threshold; If you see here "PCT" column is percentage column if this percentage is high then there

Windows Run ShortCuts

Just mention a couple of commands which uses for Windows.Go to command prompt and run these commands. NCPA.CPL CONTROL-->ControlPanel APPWIZ.CPL-->For Uninstall/Install programs COMPMGMT.MSC-->Computer Management DISKMGMT.MSC-->Disk Management TASKMGR-->TaskManager MSINFO32-->SystemInformation WINVER-->Windows versionm MSCONFIG-->System Configuration NSLOOKUP-->Default Server CONTROL ADMINTOOLS--> Admin Tools SET L-->Local App Data TASKLIST

Example For DeadLock

The dead lock behavior would be like this. This is just for  understand purpose.   In the below i have chosen another tables.                         Session1                                     Session2 1. Begin Transaction 1. Begin Transaction 2. Update Part table 2. Update Supplier table 3. Update  Supplier  table 3. Update  Part  table 4. Commit Transaction 4. Commit Transaction CREATE TABLE authors (id VARCHAR(20),Lname VARCHAR(30),Value1 VARCHAR(30),Value2 VARCHAR(30),Value3 VARCHAR(30),Value4 VARCHAR(30),Value5 VARCHAR(30),SomeValue VARCHAR(30),Sno INT) GO ---1 st window DECLARE @Au_ID VARCHAR(11) DECLARE @Au_lname VARCHAR(30) SELECT @Au_ID='111-11-1112',@Au_lname='Test1' BEGIN TRAN INSERT INTO authors VALUES(@Au_ID,@Au_lname,' ',' ',' ',' ',' ','11111',0) WAITFOR DELAY '00:00:05' SELECT * FROM Authors WHERE Lname like 'Test%' COMMIT ------2nd Window DECLARE