Posts

CTRL+R not working in SQL Server 2012 and 2014 Management tool

Image
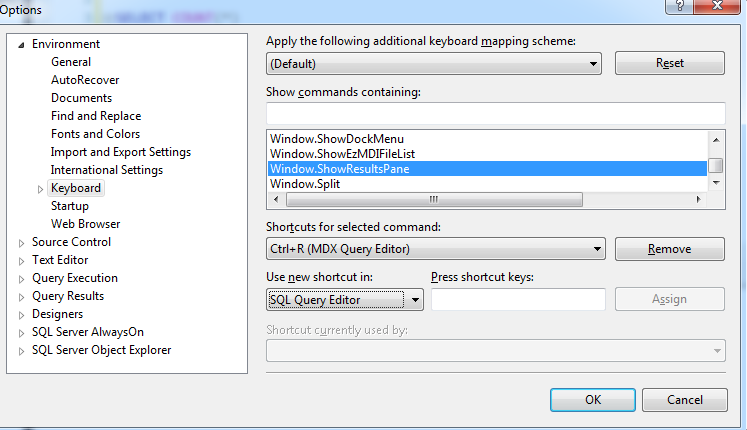
Please follow the below instructions. Select "Tools", "Customize..." - Click "Keyboard..." - In the list window, scroll down and select "Window.ShowResultsPane" - Under "Use new shortcut in:", select "SQL Query Editor" - Place your cursor in the "Press shortcut keys:" input area and press Ctrl+R - Click "Assign", then "OK"  

SQL Data page and Extent.

Image
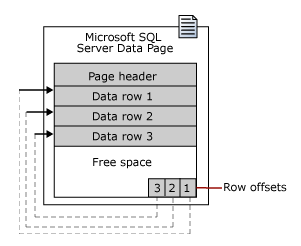
Data Page :   The size of the data page is 8KB. Data rows are put on the page serially, starting immediately after the header. A row offset table starts at the end of the page. And each row offset table contains one entry for each row on the page. Each entry records how far the first byte of the row is from the start of the page. The entries in the row offset table are in reverse sequence from the sequence of the rows on the page. Extent :   Extents are the basic unit in which space is managed. An extent is eight contiguous pages, or 64 KB. This means SQL Server database have 16 extents per megabyte (1MB). To make its space allocation efficient SQL Server does not allocate whole extents to table with small amounts of data. SQL Server has two types of events.   1 Page -> 8KB   8 Pages -> 8 * 8 = 64KB ( One Extent )     16 * 64 = 1024KB ( 1MB )    

RESTORATION OF ReportServer and ReportServerTempdb

Image
Hi, I just want to share one of my experiences as DBA. One day my boss gave me a task of restoration of ‘Reportserver’ and ‘ReportServerTempdb’ databases. This is in SQL Server 2008R2. What I did is I tried to restore the database and I got an error saying that “The database is already in Use”. So I thought there might be other sessions are open on this database. So I ran sp_who2 stored procedure and kill all  the sessions which are connecting to ‘Reportserver’ database and try to restore the database as usual. But this time also I faced the same problem. So I thought this time I will take the database in single user mode and try to restore the same. I failed in this attempt also. What I realized after some time was “Reporting Services” are running and this is stopping me to restore the database. I stopped this “Reporting Service” and restored the two databases with in one minute After few days I got an error on "ReportServerTempdb" database the error details are as bel...

sp_configure for max server memory restriction.

Image
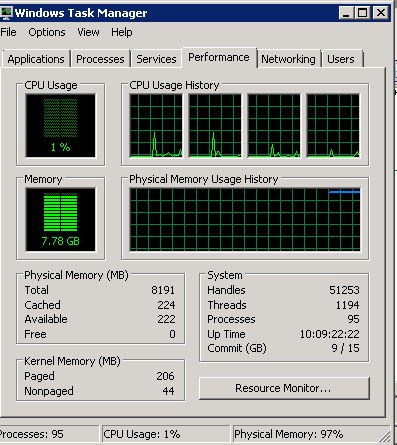
I came across below errors in my event viewer log after installing SQL Server. Error:1 Error: 17887, Severity: 10, State: 1. (Params:). The error is printed in terse mode because there was error during formatting. Tracing, ETW, notifications etc are skipped. Error:2 There was a memory allocation failure during connection establishment. Reduce nonessential memory load, or increase system memory. The connection has been closed. [CLIENT: ] Error:3 SQL Server was unable to run a new system task, either because there is insufficient memory or the number of configured sessions exceeds the maximum allowed in the server. Verify that the server has adequate memory. Use sp_configure with option 'user connections' to check the maximum number of user connections allowed. Use sys.dm_exec_sessions to check the current number of sessions, including user processes. Error:4 BRKR TASK: Operating system error Exception 0x1 encountered. Error:5 Error: 17300, Severity: 16, State: 1...
Replication Agents in SQL Server 2008.

SQL Server Agent jobs are key components of replication. A number of SQL Agent jobs are created by replication. 1) Snapshot Agent: The Snapshot Agent is a SQL Agent job that takes and applies the snapshot either for setting up transactional or merge replication or for a snapshot replication. 2) Log Reader Agent: The Log Reader Agent is the SQL Agent job that reads the transaction log on the publisher and records the transactions for each article being published into the distribution database. 3) Distribution Agent: The Distribution agent is the SQL Agent job that reads the transactions written to the distribution database and applies them to the subscribing database. 4) Merge Agent: The Merge agent is the SQL Agent job that manages activities of Merge replication. 5) Other Agents: You may come across quite a few other SQL Agent Jobs, as described in the following list a) Queue Reader Agent b) History Agent c) Distribution Cleanup d) Expired subscription cleanup e) Repl...

SET STATISTICS IO ON/OFF Command

Let us look at the STATISTICS IO output for the example of the query. This is a session level setting STATISTICS IO provides you with I/O related information for the statement you run. DBCC DROPCLEANBUFFERS GO SET STATISTICS IO ON--This is session level command GO SELECT SalesOrderID,OrderDate,CustomerID FROM dbo.New_SalesOrderHeader GO SET STATISTICS IO OFF If we run the above command in AdventureWorks2008 database we will get the results as below Table ‘New_SalesOrderHeader’. Scan count 1, logical reads 799, physical reads 0, read-ahead reads 798, lob logical reads 0, lob physical reads 0, lob read-ahead reads 0. Scan Count: Scan count tells you that how many times the table was accessed for this query. Logical Reads: This counter indicates that how many pages were read from data cached. In this case total 799 pages read from data cache. PhysicalReads: This counter indicates that the number pages read from the disk here it is 0 that means there is no physical read from the ...

CLEARING DNS CACHE

ipconfig /release ipconfig /flushdns ipconfig /renew

Optimizing SQL Server CPU Performance.

I am trying to add some more additional explanation to the below points. A) SQL Server Access Methods: (1) Index Search/Per Second: Number of index searches. Index searches are used to start range scans, single index record fetches, and to reposition within an index. Index searches are preferable to index and table scans.  For OLTP applications, optimize for more index searches and less scans (preferably, 1 full scan for every 1000 index searches). Index and table scans are expensive I/O operations. (2) Full Scans/Sec : This counter monitors the number of full scans on base tables or indexes. Values greater than 1 or 2 indicate that we are having table / Index page scans. If we see high CPU then we need to investigate this counter, otherwise if the full scans are on small tables we can ignore this counter.  A few of the main causes of high Full Scans/sec are • Missing indexes • Too many rows requested Queries with missing indexes or too many rows requested w...

Logical Read Vs Physical Read along with Buffer Hit Ratio.

Logical Reads: Reading data pages from Cache. Physical Reads : Reading Data Pages from Hard Disk Buffer Cache Hit Ratio: (logical reads-Physical Reads)/logical read*100% Logical Reads:   Logical read indicates total number of data pages needed to be accessed from data cache to process a query. It is very possible that logical read will access the same data pages many times. So count of logical read value may be higher than actual number of pages in a table. Usually the best way to reduce logical read is to apply correct index or to rewrite the query. Physical Reads: Physical read indicates the total number of pages that are read from disk. In case no data in data cache, the physical read will be equal to number of logical read. And usually it happens for first query request. And for subsequent same query request the number will be substantially decreased because the data pages have been in the data cache. Buffer Cache Hit Ratio:   Buffer hit ratio will be calcu...

"Log On Error"

Image
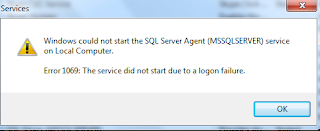
Some times we my get "Log on Error" while we are trying to start the SQL Services.You can find the below error while you are trying to start "SQL Server Agent".And the reason would be we will periodically change the password for Windows.If we change the password for windows and if we did not change it to SQL Service. We may encounter this problem.So if we change the password for SQL Service similar to windows password then this problem would resolve.

Analyzing sys.dm_os_wait_stats

The below link is explaining about the "Wait Stats" of SQL Server which was described by Paul Randal. Analyzing sys.dm_os_wait_stats

Analyzing sys.dm_db_index_physical_stats results.

Image
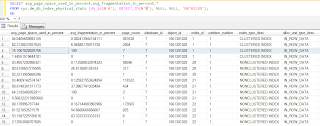
Hi In this post i am analyzing the " sys.dm_db_index_physical_stats " function results by with some production data. By seeing this we can come to below conclusions. First condition is 1) Focus on those rows which has page_count >1000 on those rows you can come to below conclusions. If fragmentation(avg_fragmentation_in_percent) is less than 5 % (avg_fragmentation_in_percent)--> Leave as it is If fragmentation(avg_fragmentation_in_percent) is more than 5 % and less than 30% - Reorganize the index If fragmentation(avg_fragmentation_in_percent) is more than 30% - Rebuild index and PageDencity we can caculated based on "avg_page_space_used_in_percent" column but here it is very good and it nearly 80 percent. You have to check for those columns which has page_count is >1000. the avg_fragmentation_in_percent value should be as close to zero as possible , and the avg_fragment_size_in_pages should be as high as possible. And also there are 2 mor...

What is Sleeping/Awaiting Command Session

Image
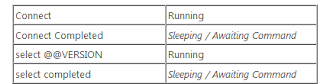
A session with the status of Sleeping/awaiting command is simply client connection with no active query to the sql server.The table below shows transitions from "running" to "sleeping" states for a session. The question usually around a session that is holding locks and its state is sleeping/Awaiting command.If the client has a open transaction and the client did not submit Commit or Rollback command the state is showing as Sleeping/Awaiting command. We can examine this by running the below query. Open a new query window in AdventureWorks database. And run the below query. Now go to another window run the below query and see the state. It is in Sleeping mode. Giving some more in depth explanation about : A thread is using the CPU (called RUNNING) until it needs to wait for a resource. It then moves to an unordered list of threads that are SUSPENDED. In the meantime, the next thread on the FIFO (first-in-first-out) queue of threads waiting for the ...

SQL Server Activity Monitor Explanations.

The Activity Monitor gives you a view of current Connections on instance.The monitor can be used to determine whether you have any processes blocking other processes.To open Activity Monitor in Management Studio,right click on server in the object explorer,Then select Activity Monitor. Session ID: The unique number assigned to a process connected to SQL Server. This is also called a SPID. An icon next to the number represents what is happening in the connection. If you see an hourglass, you can quickly tell that the process is waiting on or is being blocked by another connection. User Process Flag: Indicates whether processes that are internal SQL Server processes are connected.These processes are filtered out by default. You can change the value to see the SQL Server internal processes by clicking the drop down and selecting the appropriate value. Login: The login to which the process is tied. Database: The current database context for the connection. Task State: Indic...

StartUp parameters description in SQL Service Properties

In the sql server configuration Manager once we find the services. Right click on the service and go to properties and Advanced tab. Check the start up parameters. Below are the description for the parameters. -d switch specifies the database file -l switch specifies the log file -T which enables you to start given trace flags for all the connections for sql server instance. To monitor trace flags –T1204 and to turn on trace flag to monitor deadlocks in the instance. -f switch places sql server in minimal mode and only allow single connection. –f option correct the memory setting. -g switch is used to reserve the additional memory outside SQL Server main memory pool for use by extended stored procedures. If the –g switch is not used the default of 256MB of memory is allocated to this area. -m the “-m” switch puts sql server in single-user mode (sometimes called master recovery model) and suspends the CHECKPOINT process which writes data from disk to...